Charting Task Success with Zoho Analytics
some thing
https://d1y8p27odt6lnh.cloudfront.net/default-uploads/Zoho+Analytics.png

Challenge

Navigating task data can be like solving a puzzle. Traditional reports often lack the visual appeal and depth needed to quickly comprehend key performance indicators (KPIs) and understand the overall task landscape.

Specific Client Needs
  • KPI Clarity:

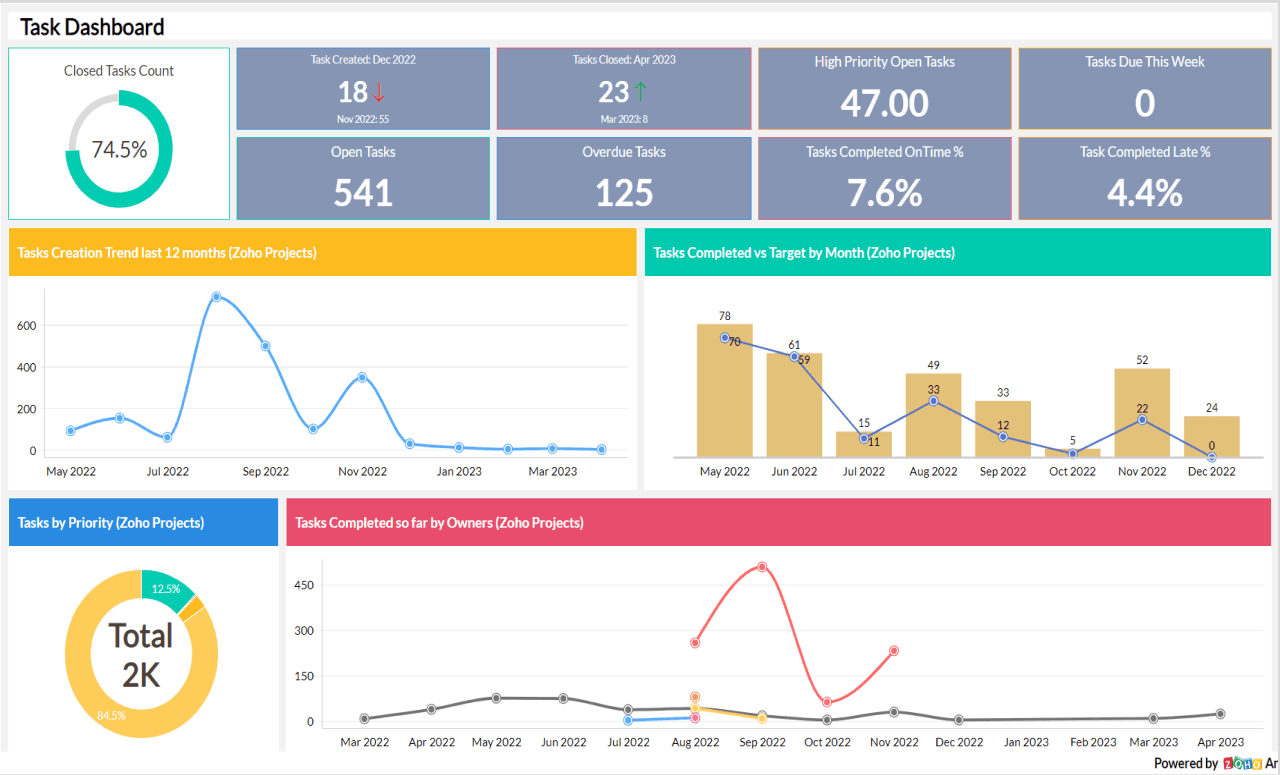
    A thirst for clarity on task KPIs like task created, task closed, high priority tasks, due tasks, open tasks, overdue tasks, task completion on time %, and task completed late %.

  • Trend Insights:

    A desire for trend charts showcasing task creation trends and bar charts comparing task completion versus targets on a monthly basis.

  • Owner Performance:

    The need for bar charts displaying task completion by owners and a pie chart illustrating tasks categorized by priority.

Platforms used

Zoho Analytics

Tailored Solution for Your Zoho Analytics Task Summary Report

Revolutionize your task management with our Zoho Analytics Task Summary Report, offering a visual journey through key performance indicators and task insights. From task creation to completion, our report provides a detailed view of your task landscape.

Dive into the dynamics with trend charts showcasing task creation trends and bar charts comparing task completion versus targets every month. Gain insights into owner performance with bar charts displaying task completion by owners and a pie chart categorizing tasks by priority.

Our report transforms raw task data into a visual narrative, making complex information accessible for strategic decision-making.

Request A Service

Contact

Featured Blogs

Cross-Platform Marketing Insights Report

Cross-Platform Marketing Insights Report

Get daily insights, custom metrics, and real-time performance data from Google Ads, Facebook Ads, Instagram, and more. Statfinity’s user-friendly solution simplifies complex data, helping you make smart decisions for successful ad campaigns. Explore Now!

Power BI’s Journey through Sales Dynamics

Power BI’s Journey through Sales Dynamics

Boost your sales game with our easy-to-use Power BI Sales Report. Whether you want the big picture or a close-up view, Statfinity’s report turns complicated sales info into simple, actionable insights. Dive in now!

Discuss Your Data Challenges with Our Experts

Vision

At Statfinity, we envision a future where data isn’t just analyzed; it’s transformed into a strategic asset that propels businesses to new heights. Founded by visionary leaders and graduates from the prestigious Indian Institute of Technology (IIT) Kanpur, our vision is to pioneer a data-driven revolution, where insights become innovation and where every client experience is not just satisfactory but exceptional.

Mission

Our mission at Statfinity is to exceed expectations and redefine the benchmarks of excellence in Data Science, Business Intelligence, and Analytics. We are committed to empowering our clients with insights that drive informed decision-making. With a relentless pursuit of excellence, we go beyond the ordinary, putting in 200% effort to not just meet but exceed our clients’ expectations. We believe in delivering not just services, but experiences that inspire confidence and success.