Databox Survey Analytics Unleashed

some thing
https://d1y8p27odt6lnh.cloudfront.net/default-uploads/Databox.png

Challenge

Understanding customer sentiment can be a puzzle. Traditional survey reports often lack depth, making it challenging to uncover nuanced trends and actionable insights.

Specific Client Needs
  • Granular Insights:

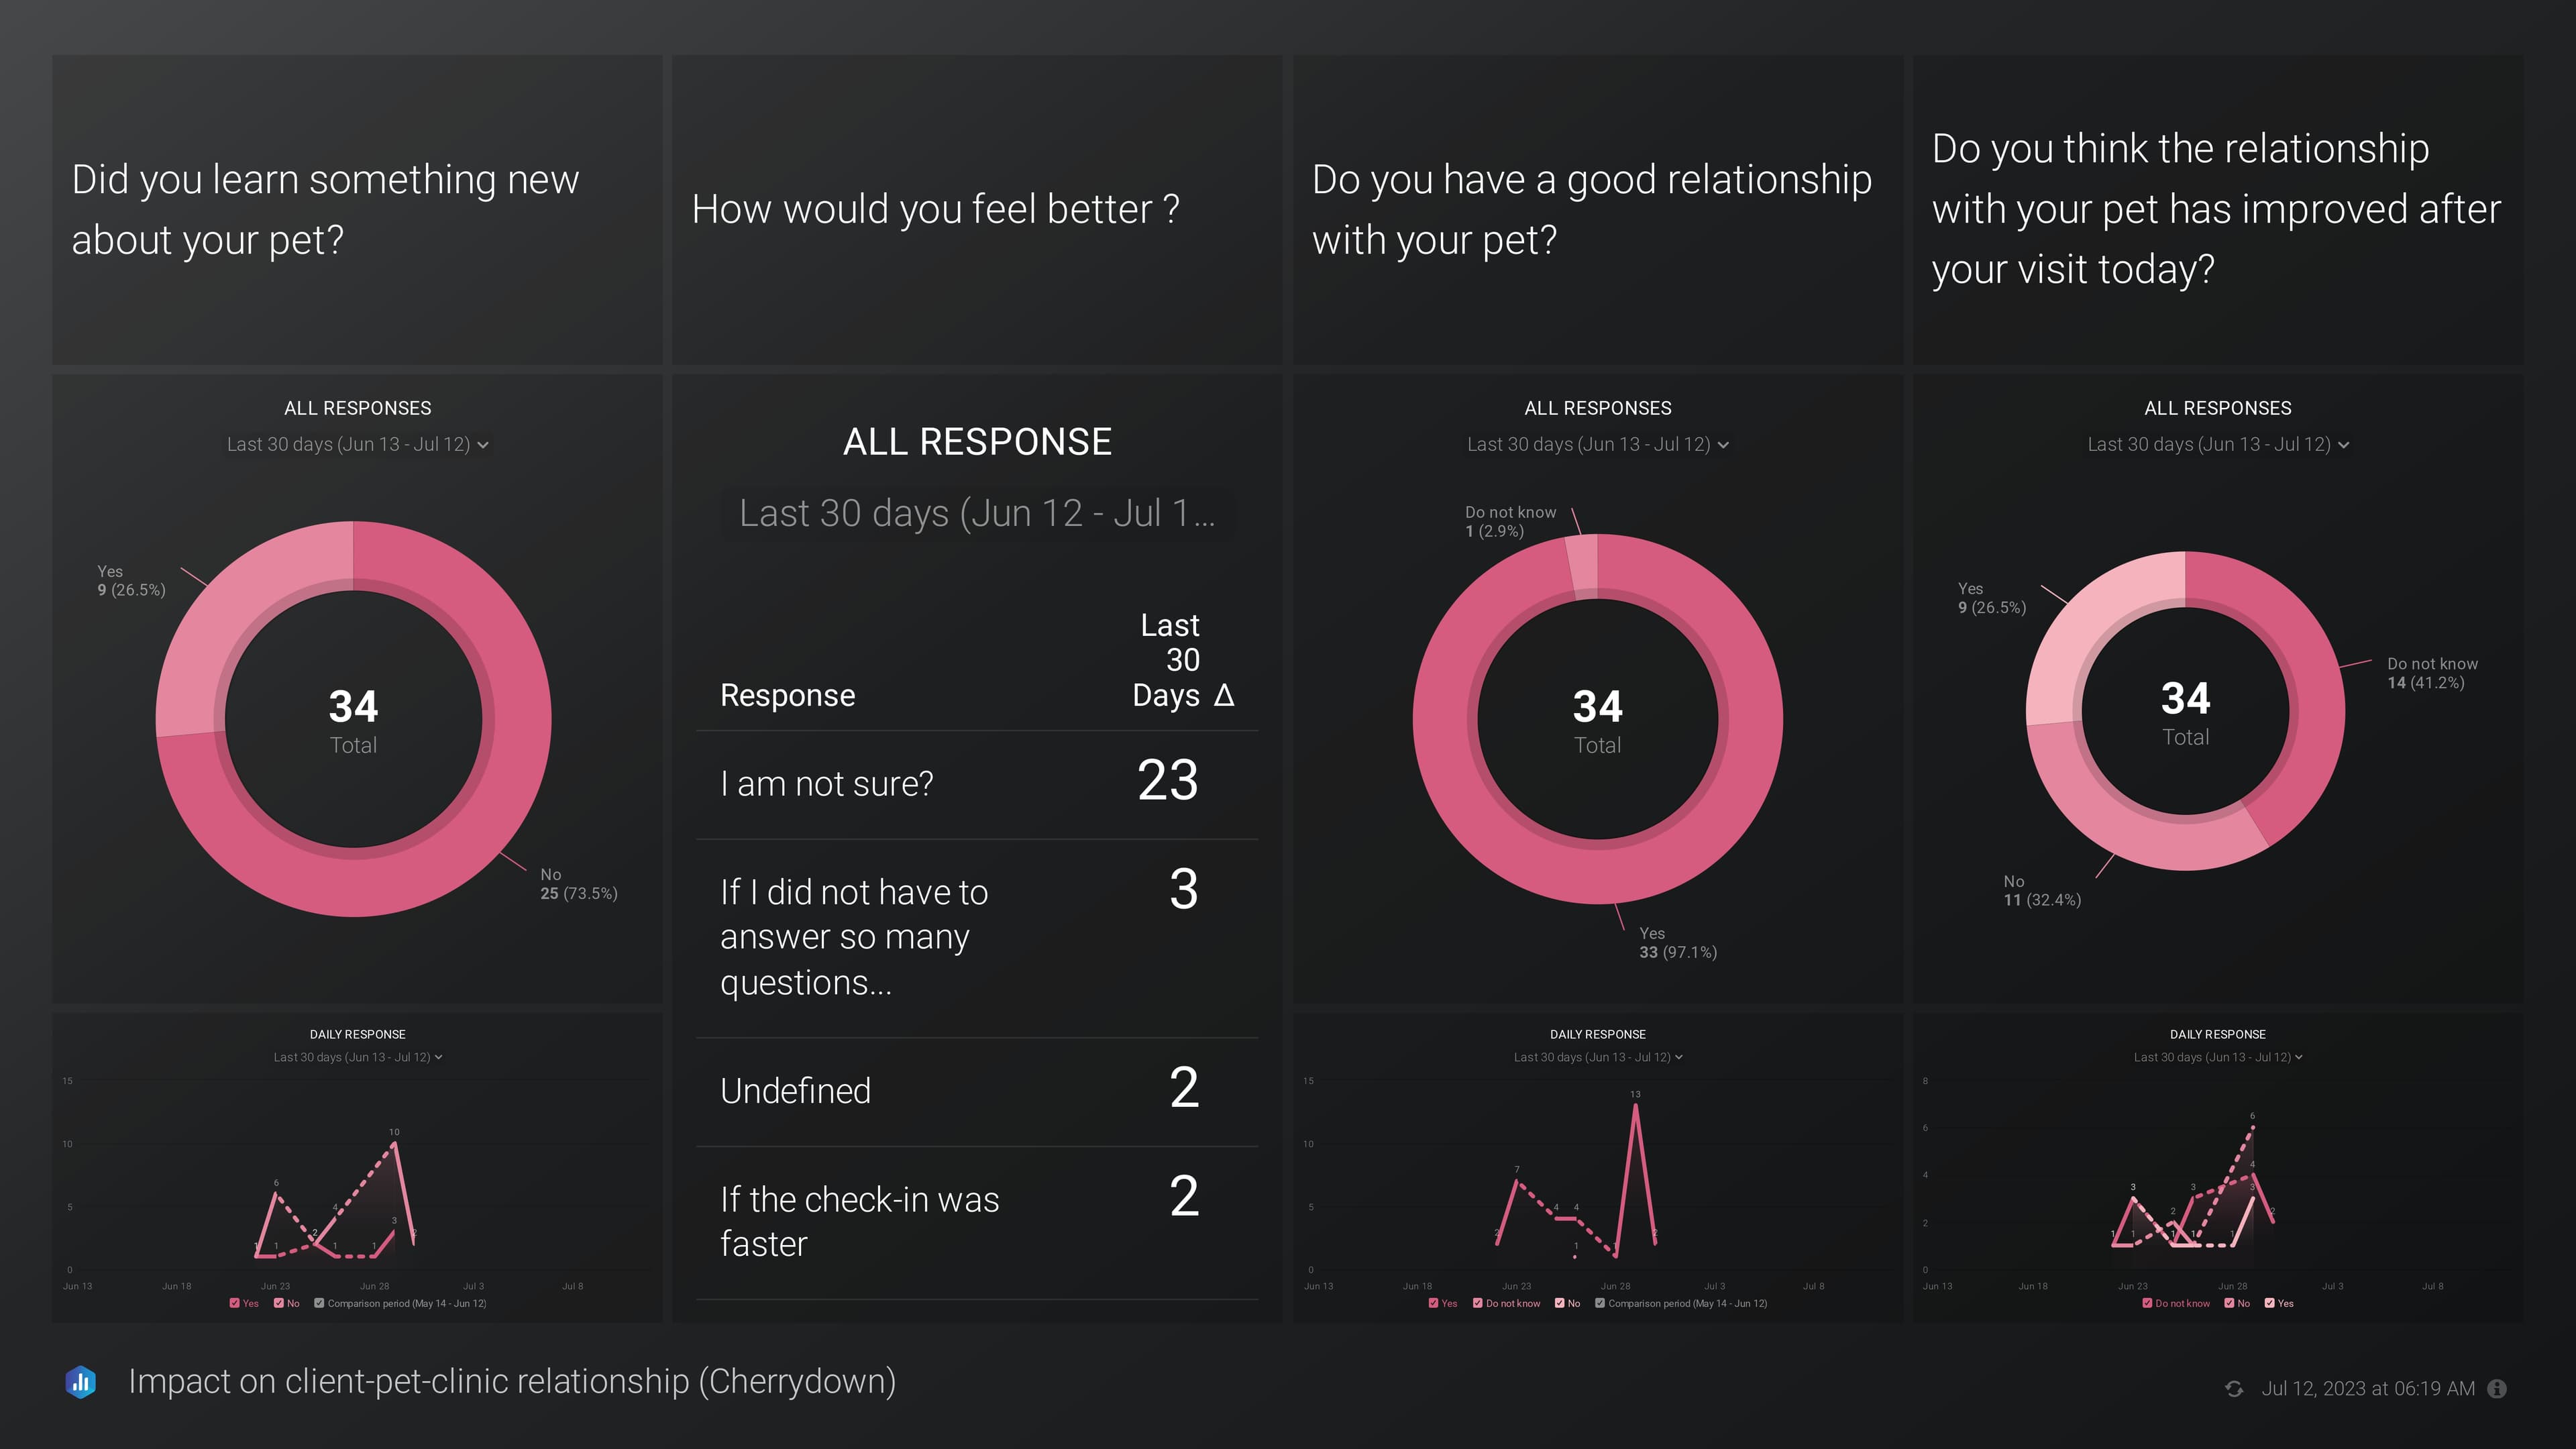
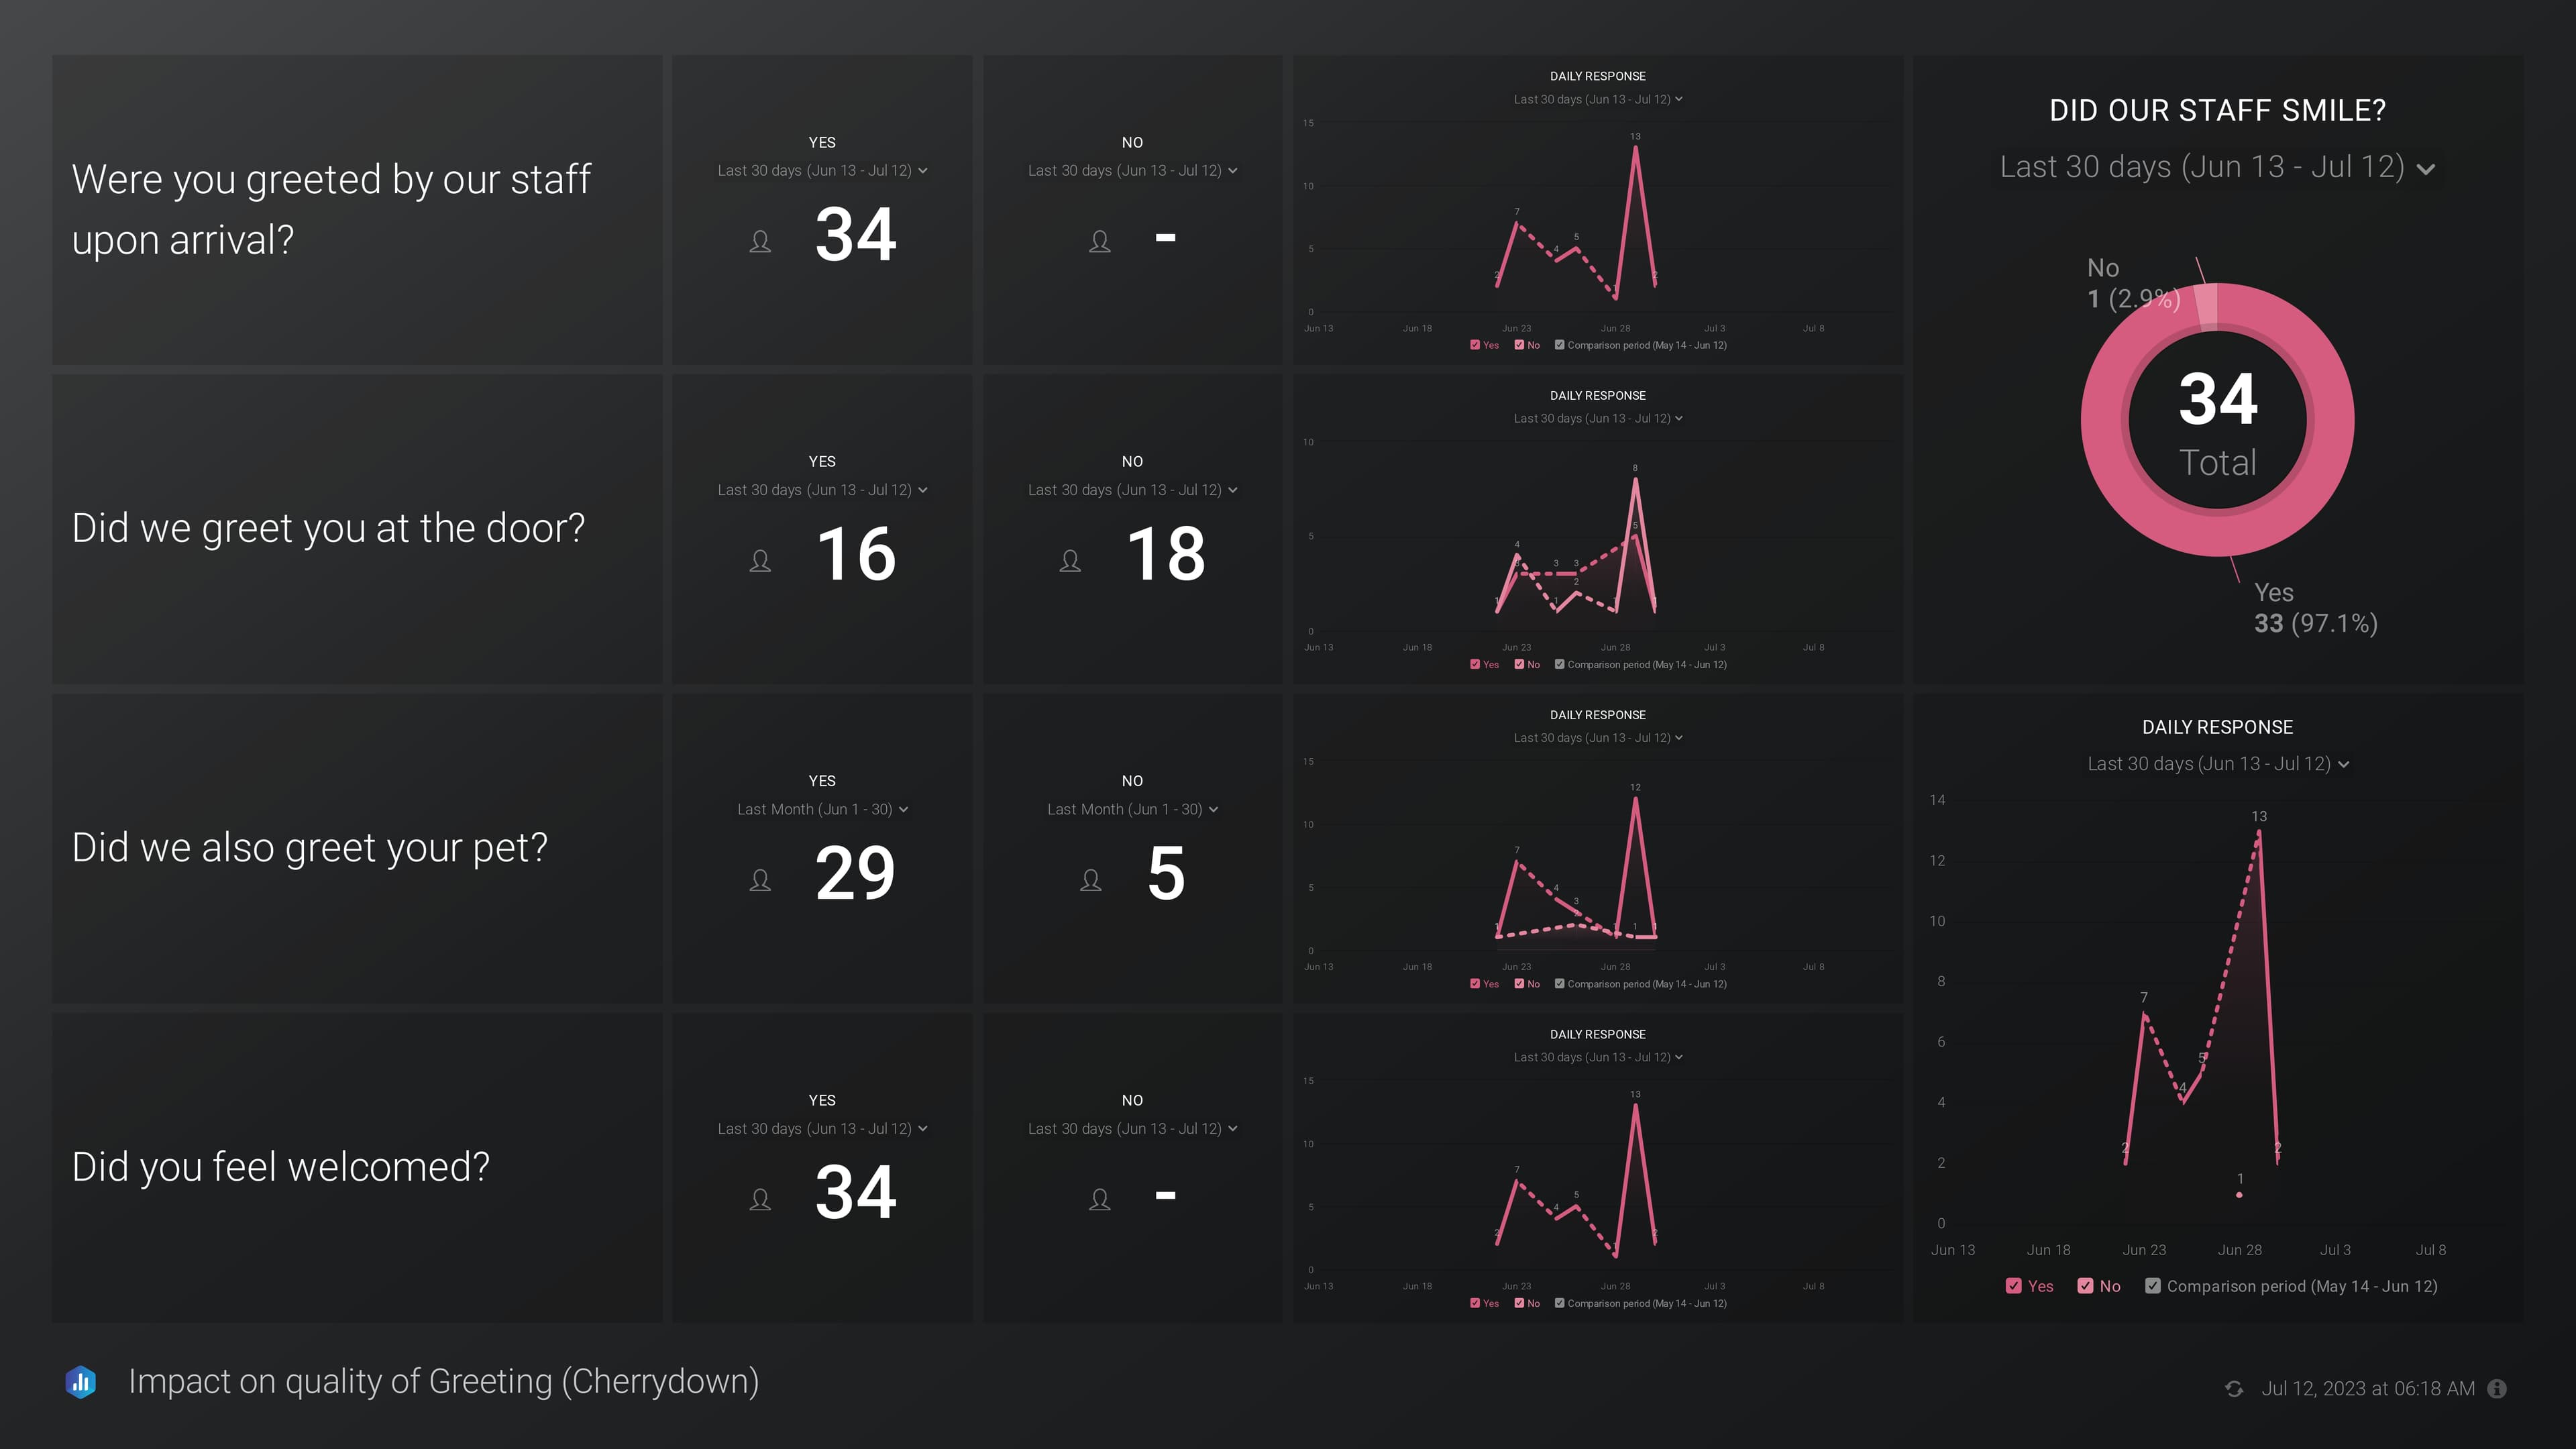
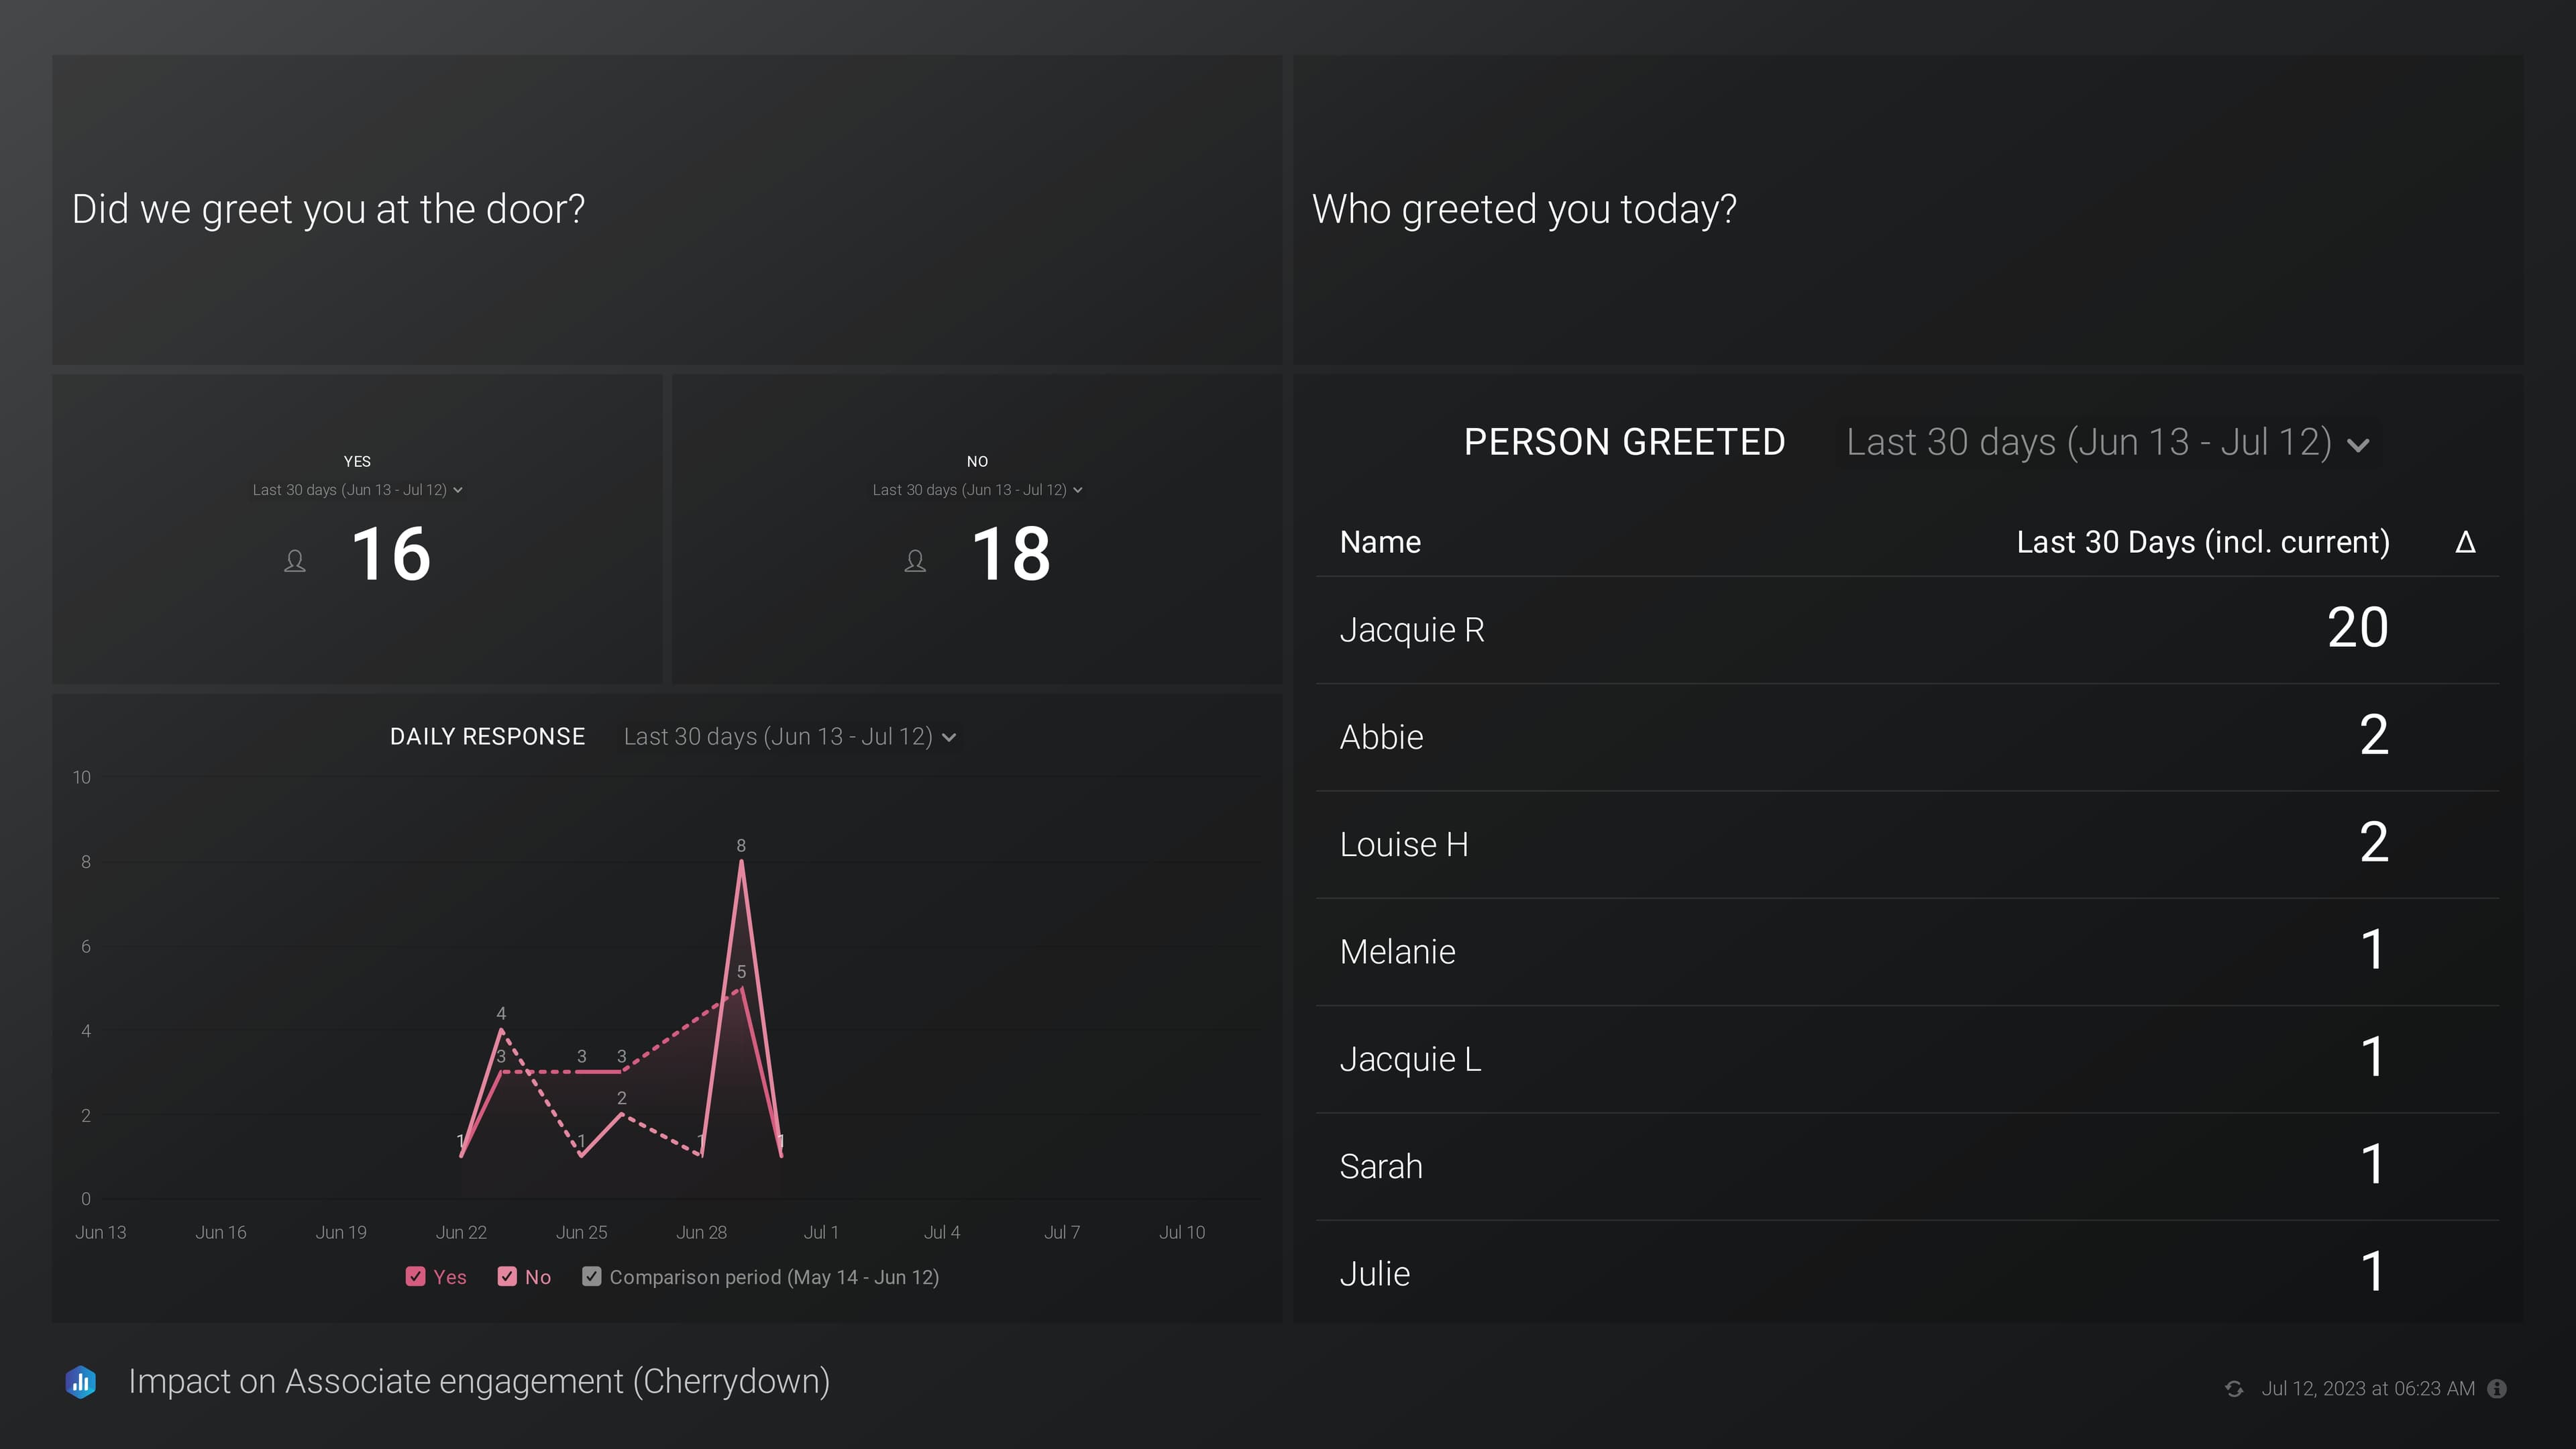
    A hunger for detailed survey analytics, providing answers to specific questions like staff greetings, pet interactions, and overall feelings of welcome.

  • Visual Clarity:

    A desire for a visual-centric report with scorecards, line charts, and pie charts, simplifying the interpretation of survey responses.

  • Executive Filters:

    The need to drill down into data with executive-wise filters for a personalized view of survey analytics.

Platforms used

Databox

Tailored Solution for Your Databox Survey Analytics Report

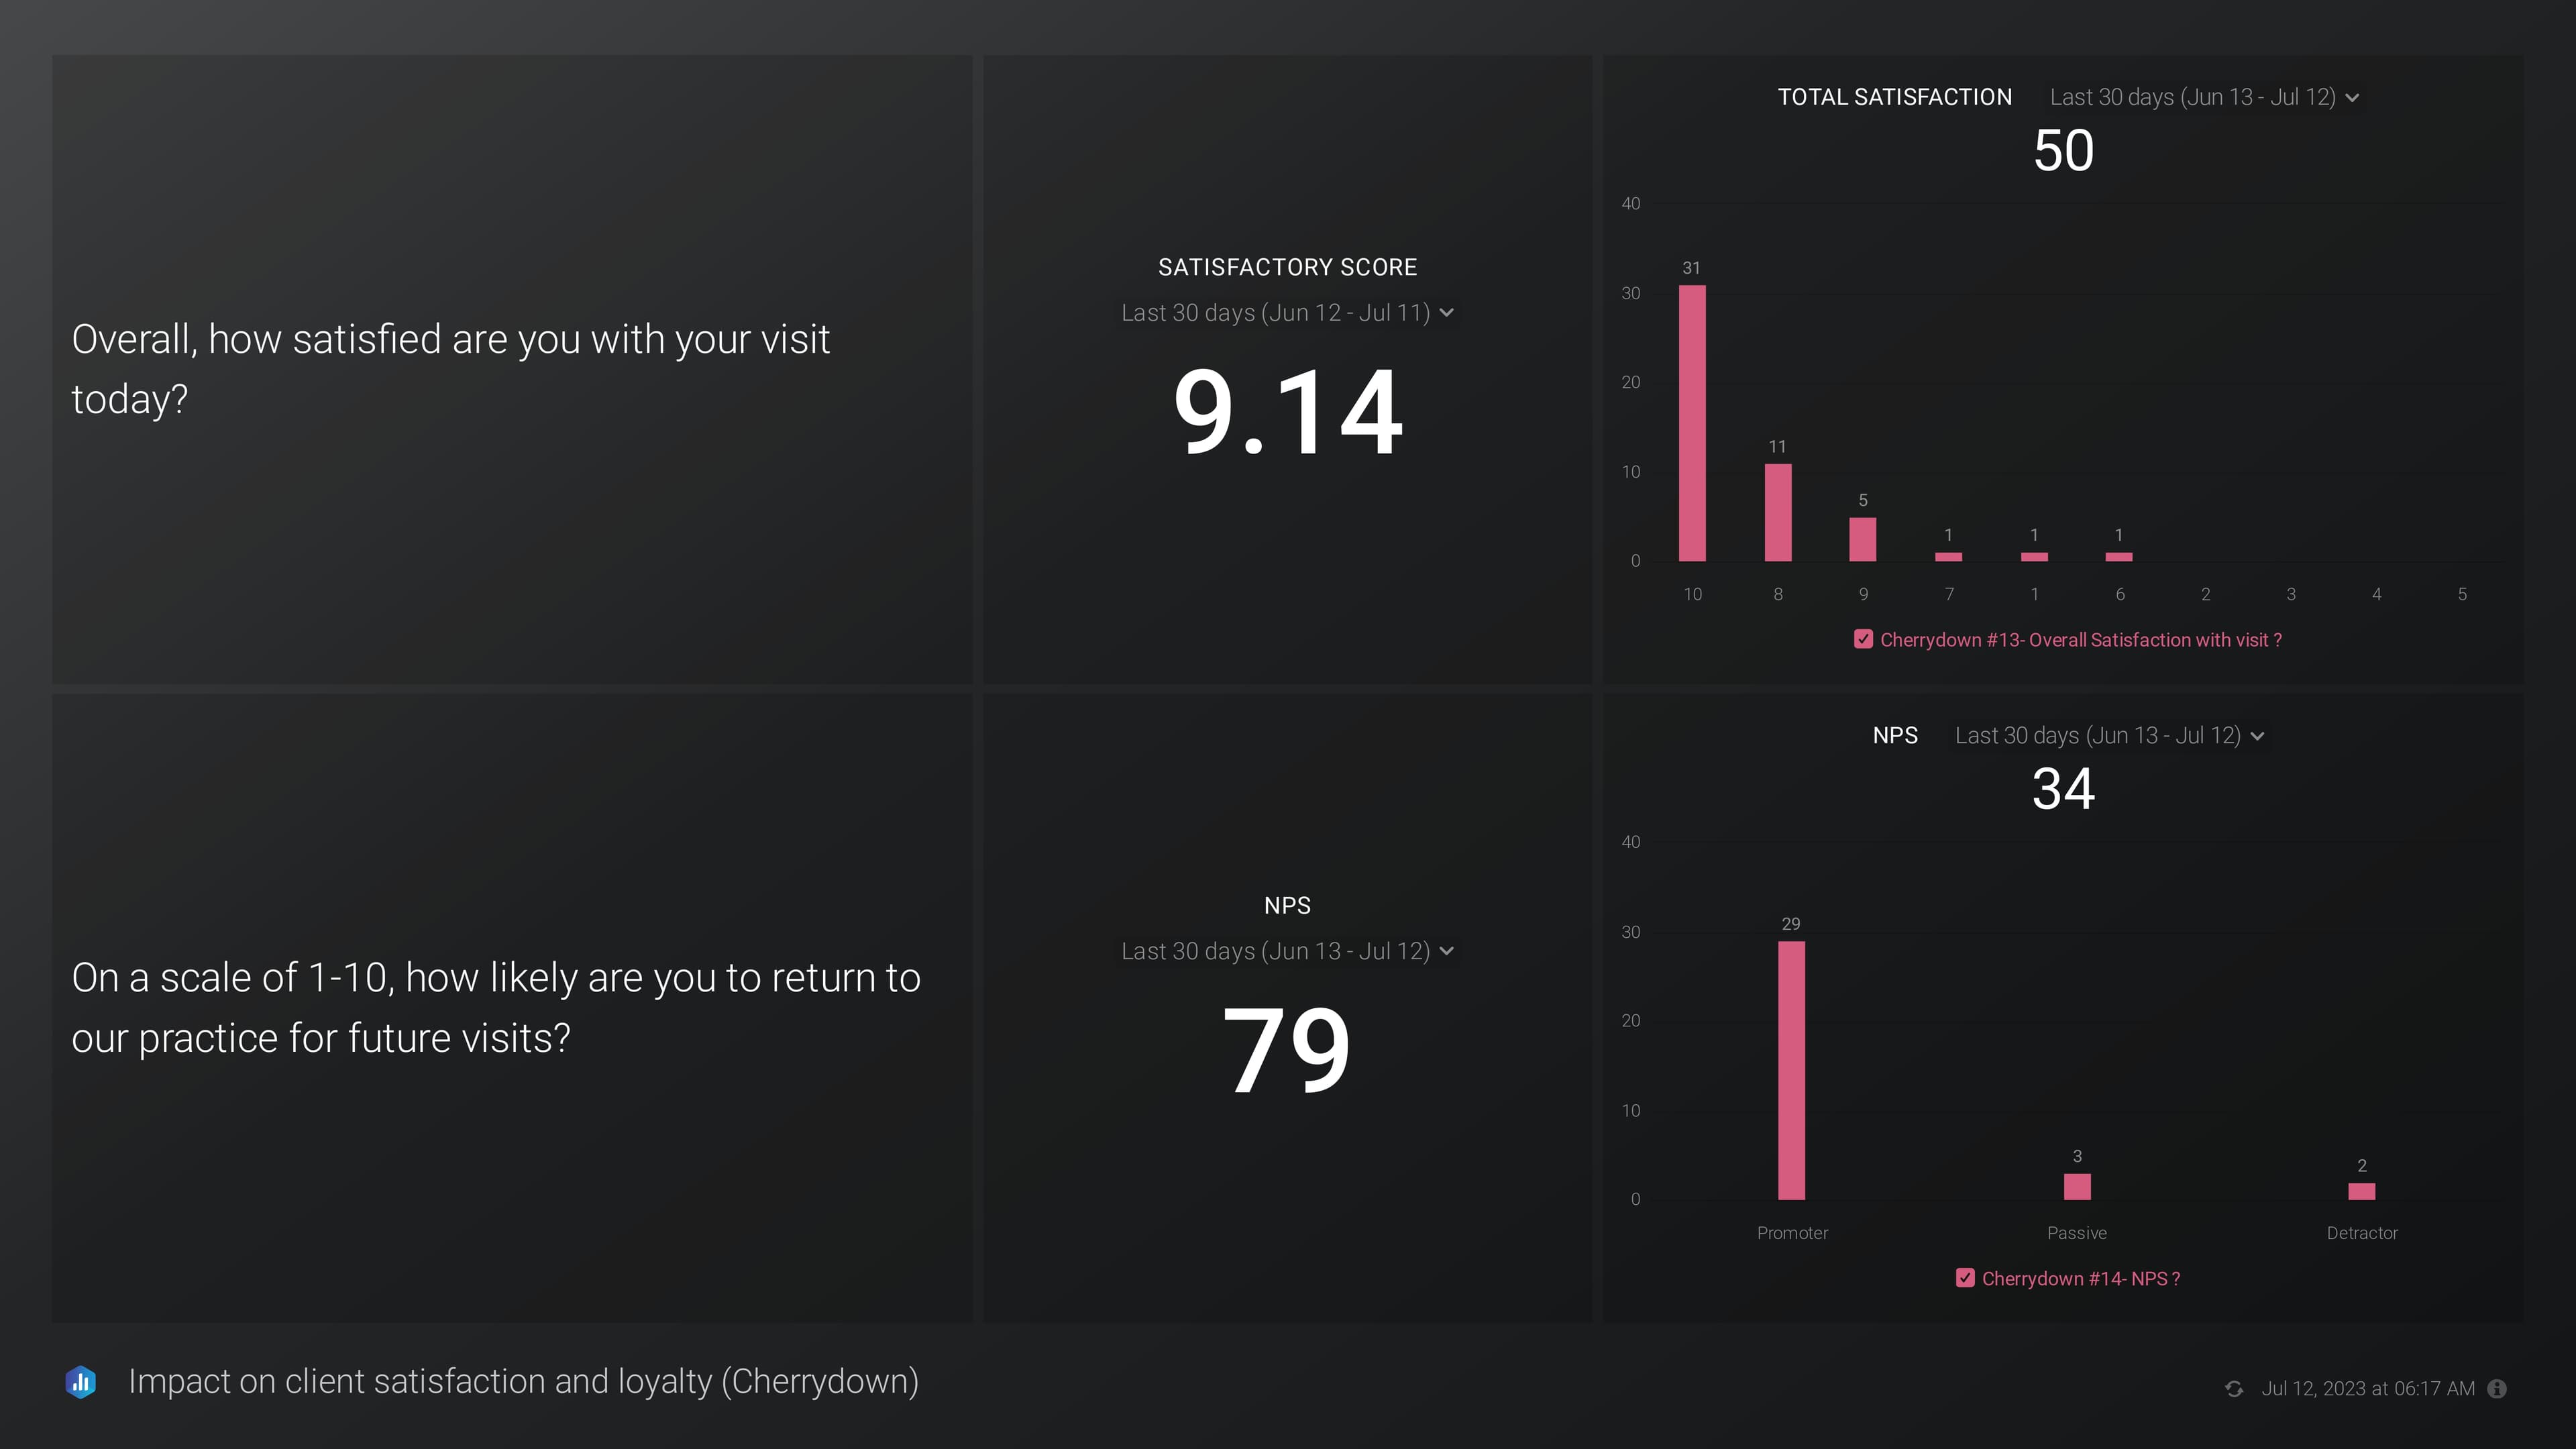
Dive into the heart of customer experience with our detailed survey analytics report on Databox. Uncover trends and key performance indicators (KPIs) related to staff greetings, door welcomes, pet interactions.

Experience the power of visual clarity as survey responses come to life through scorecards, line charts, and pie charts. Our report transforms raw data into actionable insights, making customer sentiments easily digestible.

Navigate through the details with executive-wise filters, customizing your view for a more personalized analysis. Elevate your understanding of customer experience with a survey analytics report that speaks the language of simplicity and clarity.,

Request A Service

Contact

Featured Blogs

Cross-Platform Marketing Insights Report

Cross-Platform Marketing Insights Report

Get daily insights, custom metrics, and real-time performance data from Google Ads, Facebook Ads, Instagram, and more. Statfinity’s user-friendly solution simplifies complex data, helping you make smart decisions for successful ad campaigns. Explore Now!

Power BI’s Journey through Sales Dynamics

Power BI’s Journey through Sales Dynamics

Boost your sales game with our easy-to-use Power BI Sales Report. Whether you want the big picture or a close-up view, Statfinity’s report turns complicated sales info into simple, actionable insights. Dive in now!

Discuss Your Data Challenges with Our Experts

Vision

At Statfinity, we envision a future where data isn’t just analyzed; it’s transformed into a strategic asset that propels businesses to new heights. Founded by visionary leaders and graduates from the prestigious Indian Institute of Technology (IIT) Kanpur, our vision is to pioneer a data-driven revolution, where insights become innovation and where every client experience is not just satisfactory but exceptional.

Mission

Our mission at Statfinity is to exceed expectations and redefine the benchmarks of excellence in Data Science, Business Intelligence, and Analytics. We are committed to empowering our clients with insights that drive informed decision-making. With a relentless pursuit of excellence, we go beyond the ordinary, putting in 200% effort to not just meet but exceed our clients’ expectations. We believe in delivering not just services, but experiences that inspire confidence and success.