Mapping Sales Success with Tableau

Mapping Sales Successwith Tableau
One pipeline. Every insight
Platforms used

Challenge
Navigating sales data can be like finding a needle in a haystack. Traditional reports often lack the visual appeal needed to quickly grasp key performance indicators (KPIs) and sales trends.
Specific Client Needs
- Holistic Overview:
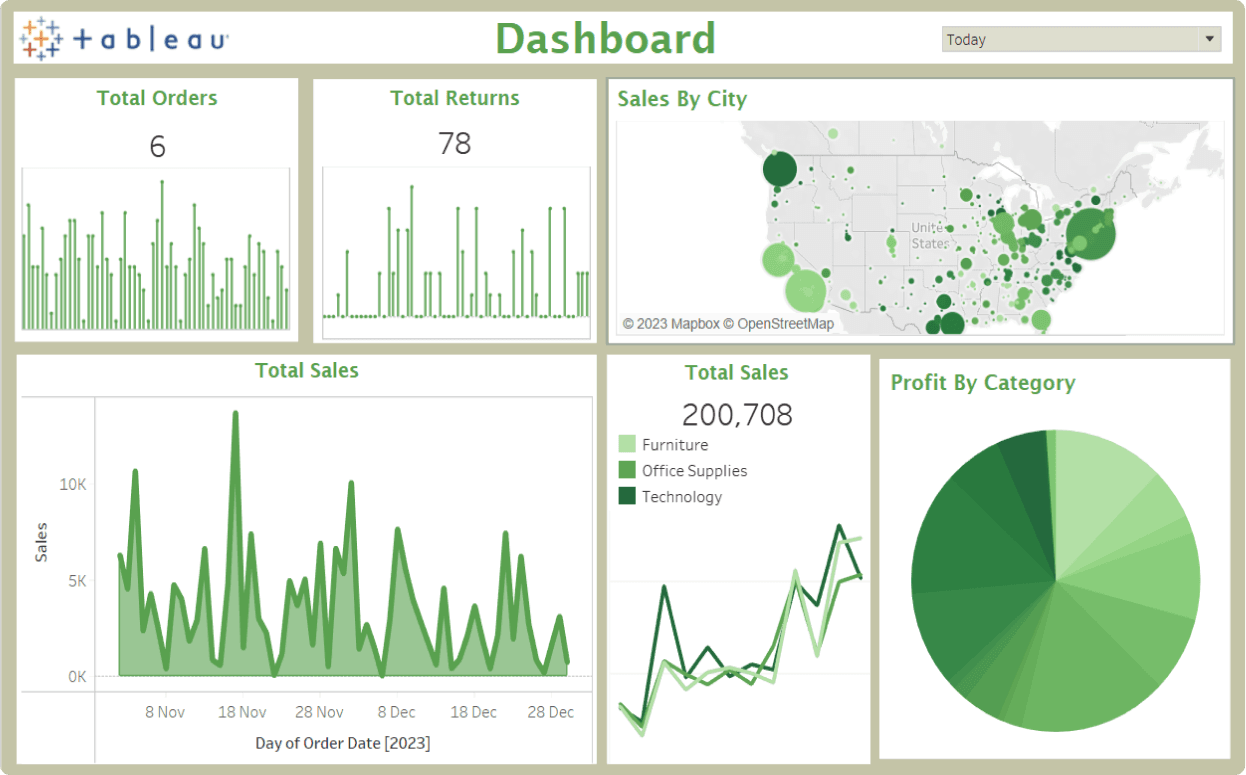
A craving for a comprehensive view of sales performance, encompassing total orders, returns, and sales trends over specific periods.
- Category Profits:
A need to understand profit distribution by category, enabling strategic decision-making.
- Geographical Insights:
The desire for a world map view, using bubbles to highlight sales by city for a global perspective.
Tailored Solution for Your Tableau Sales Report
Elevate your sales strategy with our Tableau-powered report, offering a visual feast of key performance indicators and sales insights. From total orders to returns and sales trends, our area chart provides a bird's-eye view of your sales landscape.
Dive into the specifics with a pie chart breaking down profits by category, enabling you to make informed decisions on product strategies. Explore the global reach of your sales with a world map, where bubbles dynamically highlight sales hotspots by city.
Our report transforms raw sales data into a visual narrative, making complex information accessible. Uncover the story your sales data is telling, and make strategic moves towards success.,
