Mapping User Engagement with Mixpanel
Mapping User Engagementwith Mixpanel
One pipeline. Every insight
Platforms used

Challenge
Unveiling user behavior can be akin to solving a puzzle. Traditional reports often struggle to provide a comprehensive view of user engagement and fail to deliver actionable insights.
Specific Client Needs
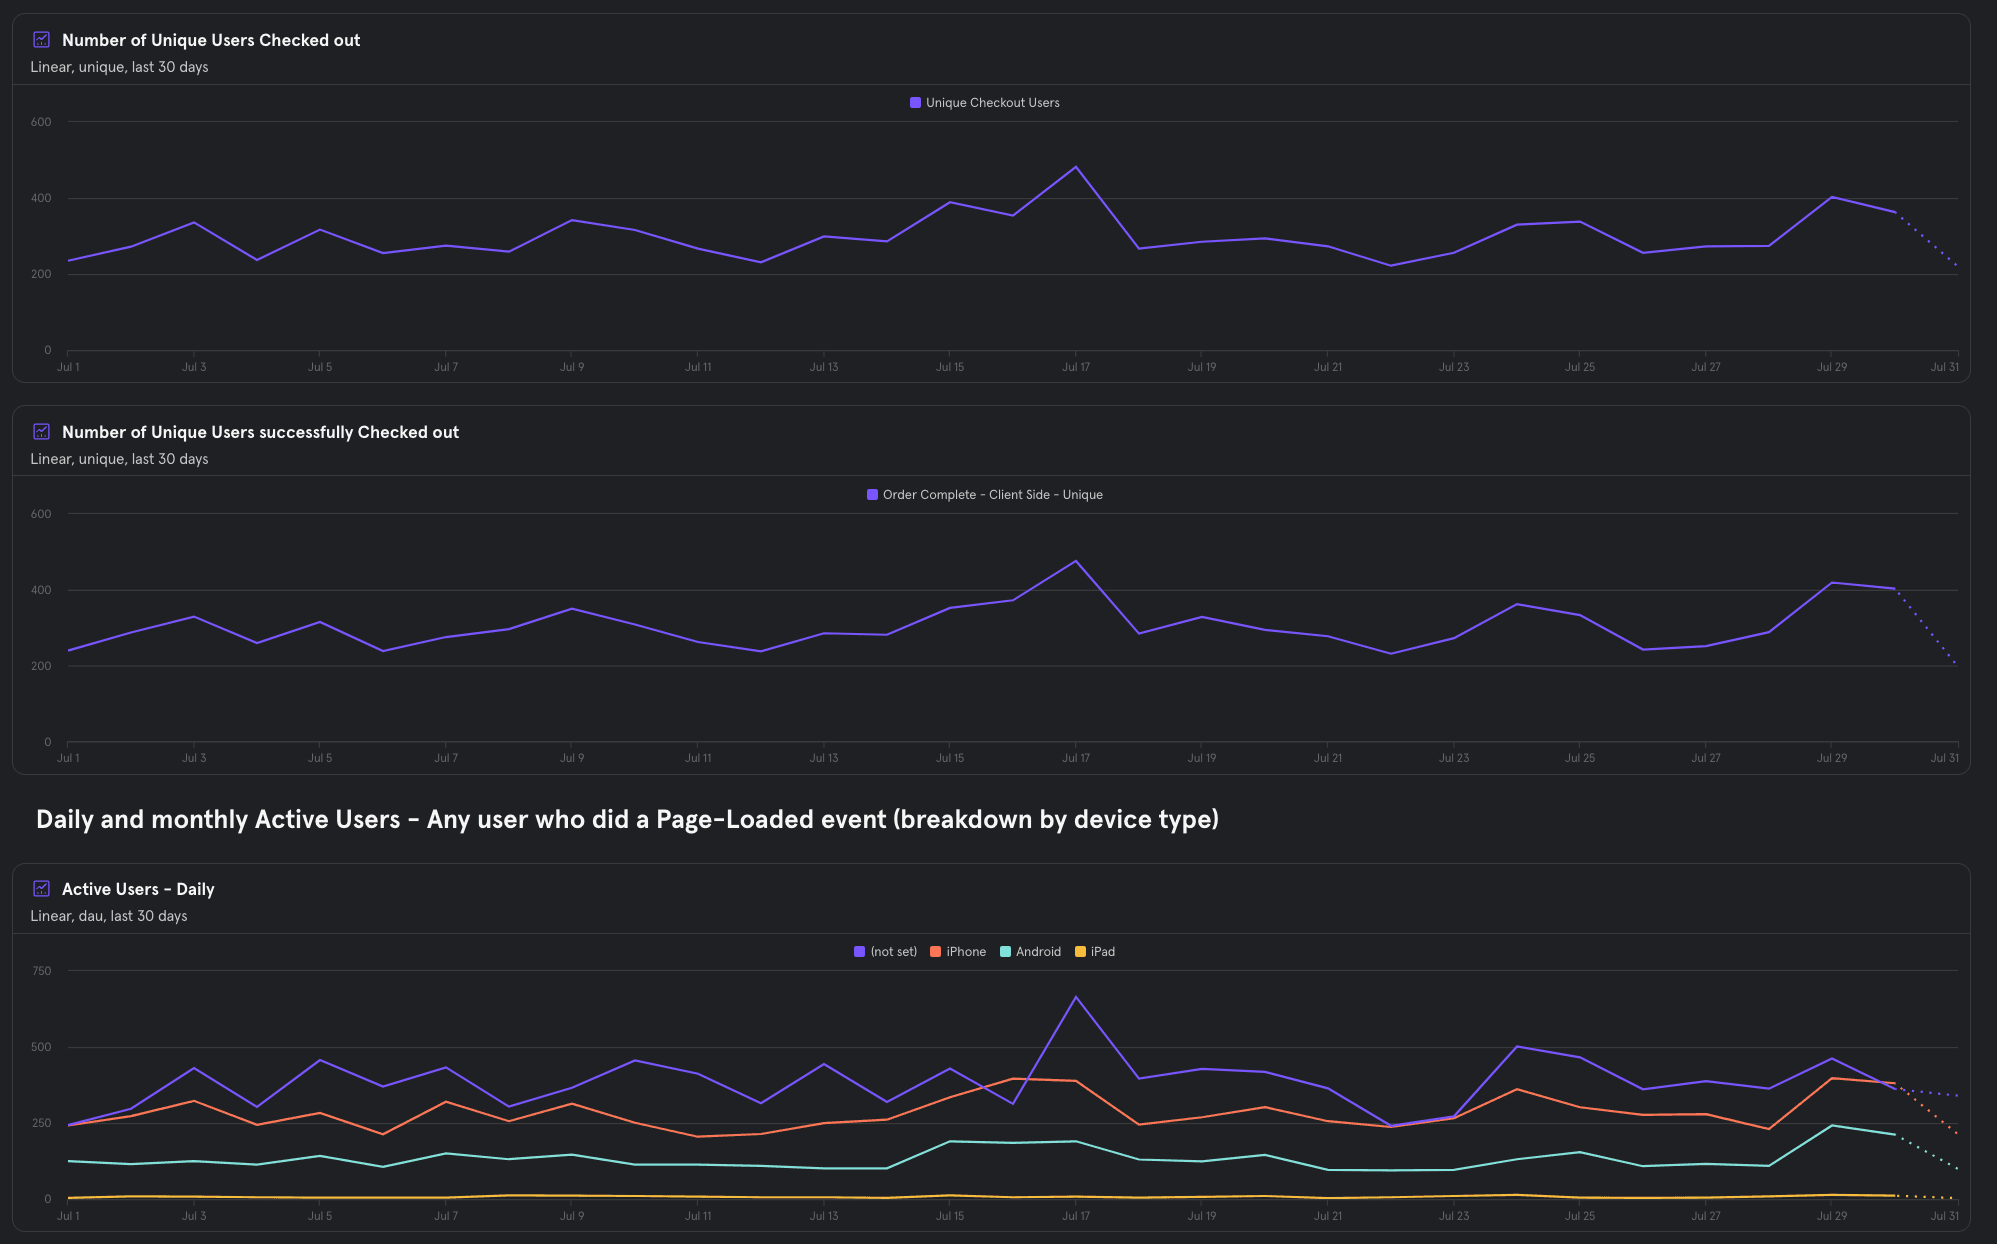
- User Journey Clarity:
A detailed clarity on user journeys, spanning from page views to successful checkouts, showcased through time series charts.
- Active User Insights:
A desire for daily and monthly active user breakdowns by device type, illustrating engagement patterns.
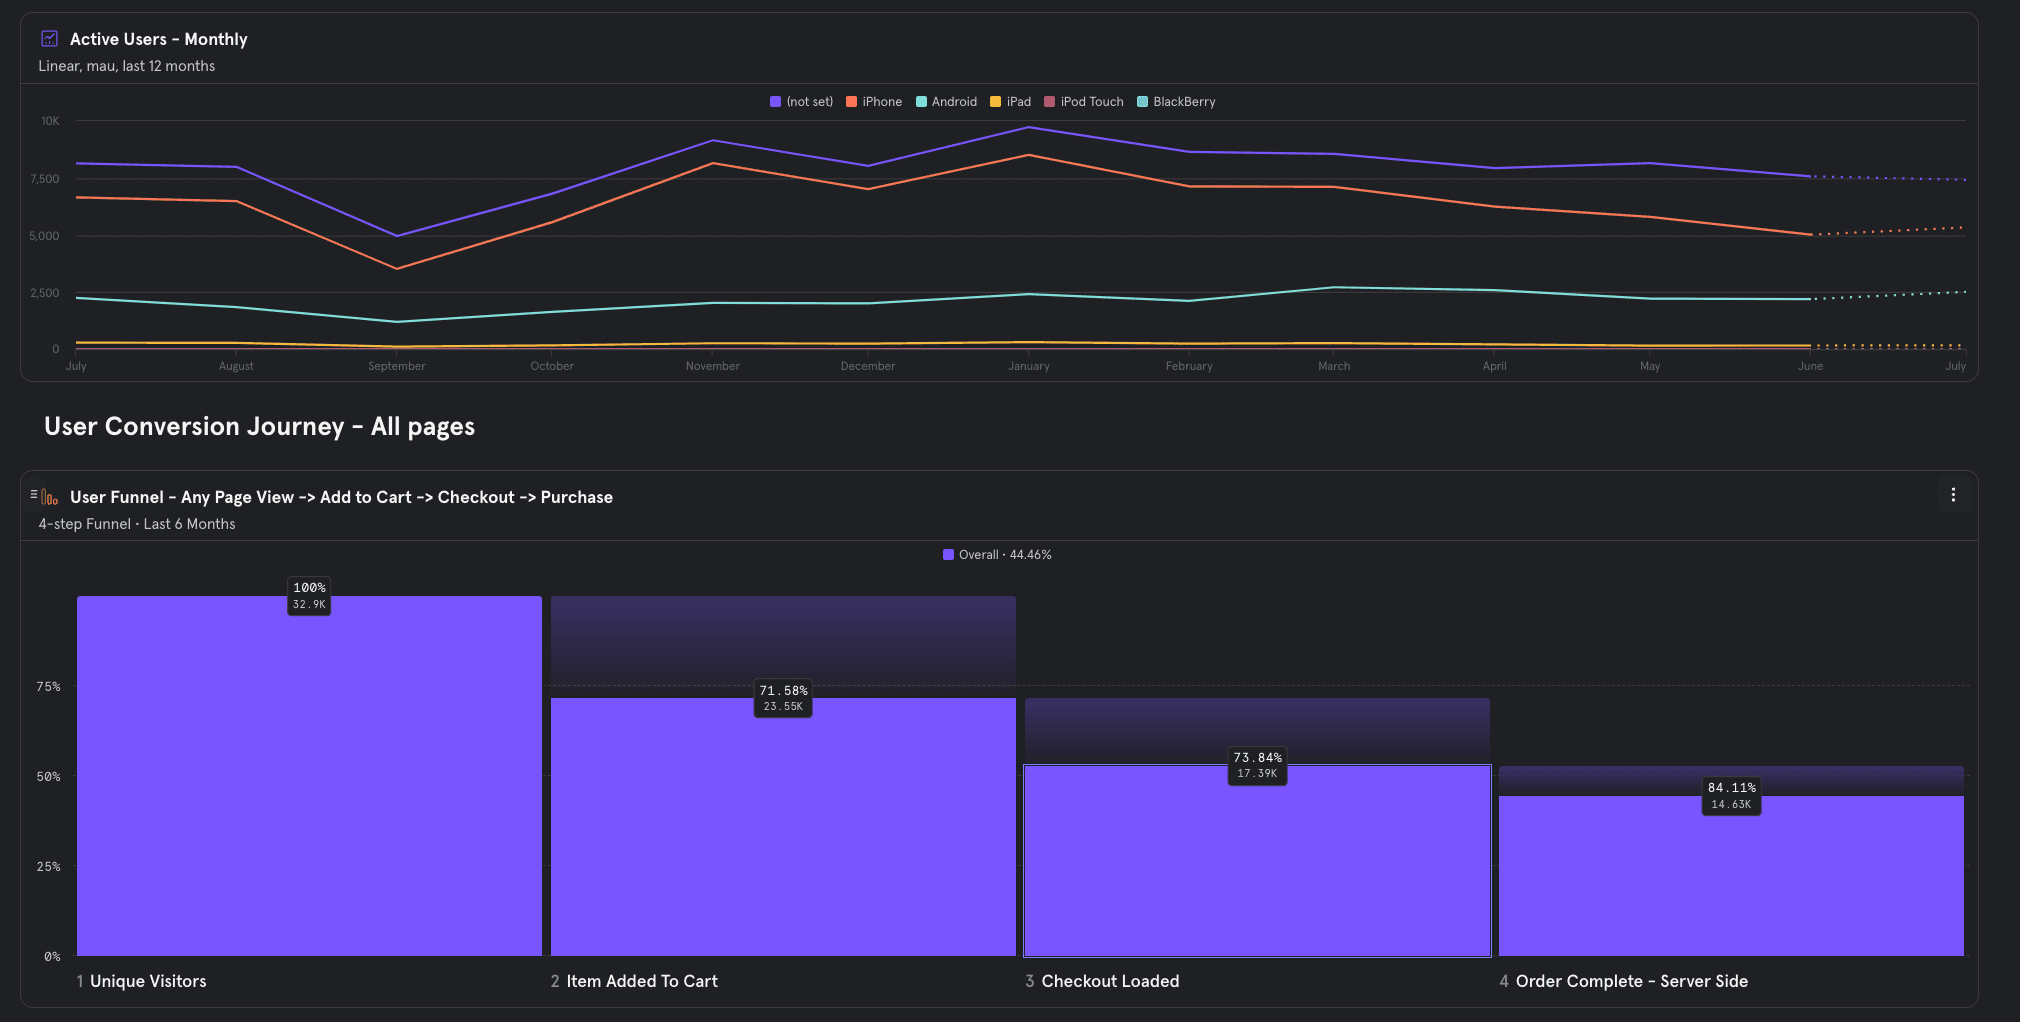
- Funnel Understanding:
The need for a funnel chart depicting user progression through stages like page view, add to cart, checkout, and order completion.
- Path Exploration:
A craving for path exploration charts, highlighting the journey users take from one page to the next.
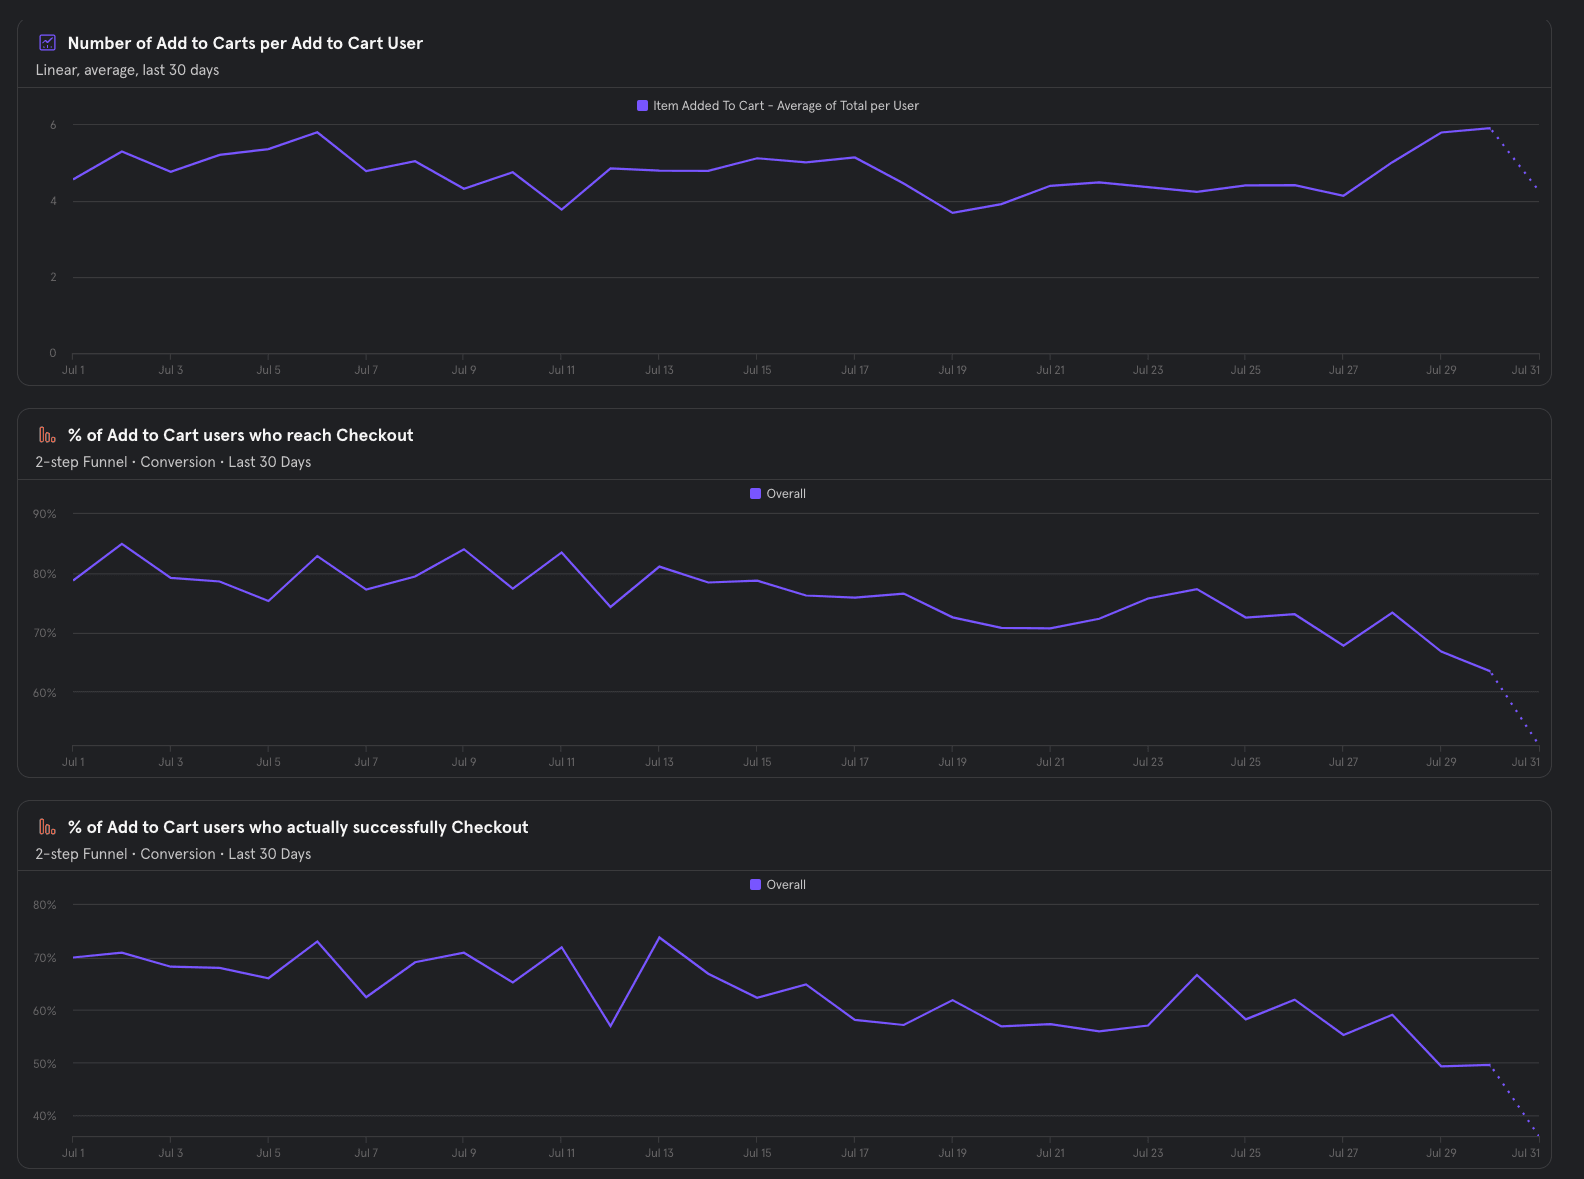
- Product Engagement:
A requirement for product engagement comparison charts and line charts depicting metrics like users viewing the product, adding it to the cart, and completing the order.
Tailored Solution for Your Mixpanel Report
Elevate your understanding of user behavior with our Mixpanel-driven report, offering a visual journey through key user engagement metrics. From time series charts showcasing unique users checked out to active user breakdowns by device type, our report provides a detailed view of user interactions.
Follow the user journey through a comprehensive funnel chart, tracking stages from page view to order completion. Delve into user paths with exploration charts, revealing the sequential pages users navigate.
Compare product engagement with insightful charts and understand the user's journey with line charts illustrating metrics such as product views, cart additions, and successful orders.
Our report transforms raw Mixpanel data into actionable insights, offering a clear picture of user behavior for strategic decision-making.,
