Power BI’s Journey through Sales Dynamics
Power BI’s Journey throughSales Dynamics
One pipeline. Every insight
Platforms used

Challenge
Unveiling sales performance insights can be like searching for a needle in a haystack. Traditional reports often lack the visual appeal and depth needed to quickly comprehend key performance indicators (KPIs) and explore sales data in a comprehensive manner.
Specific Client Needs
- Holistic Performance View:
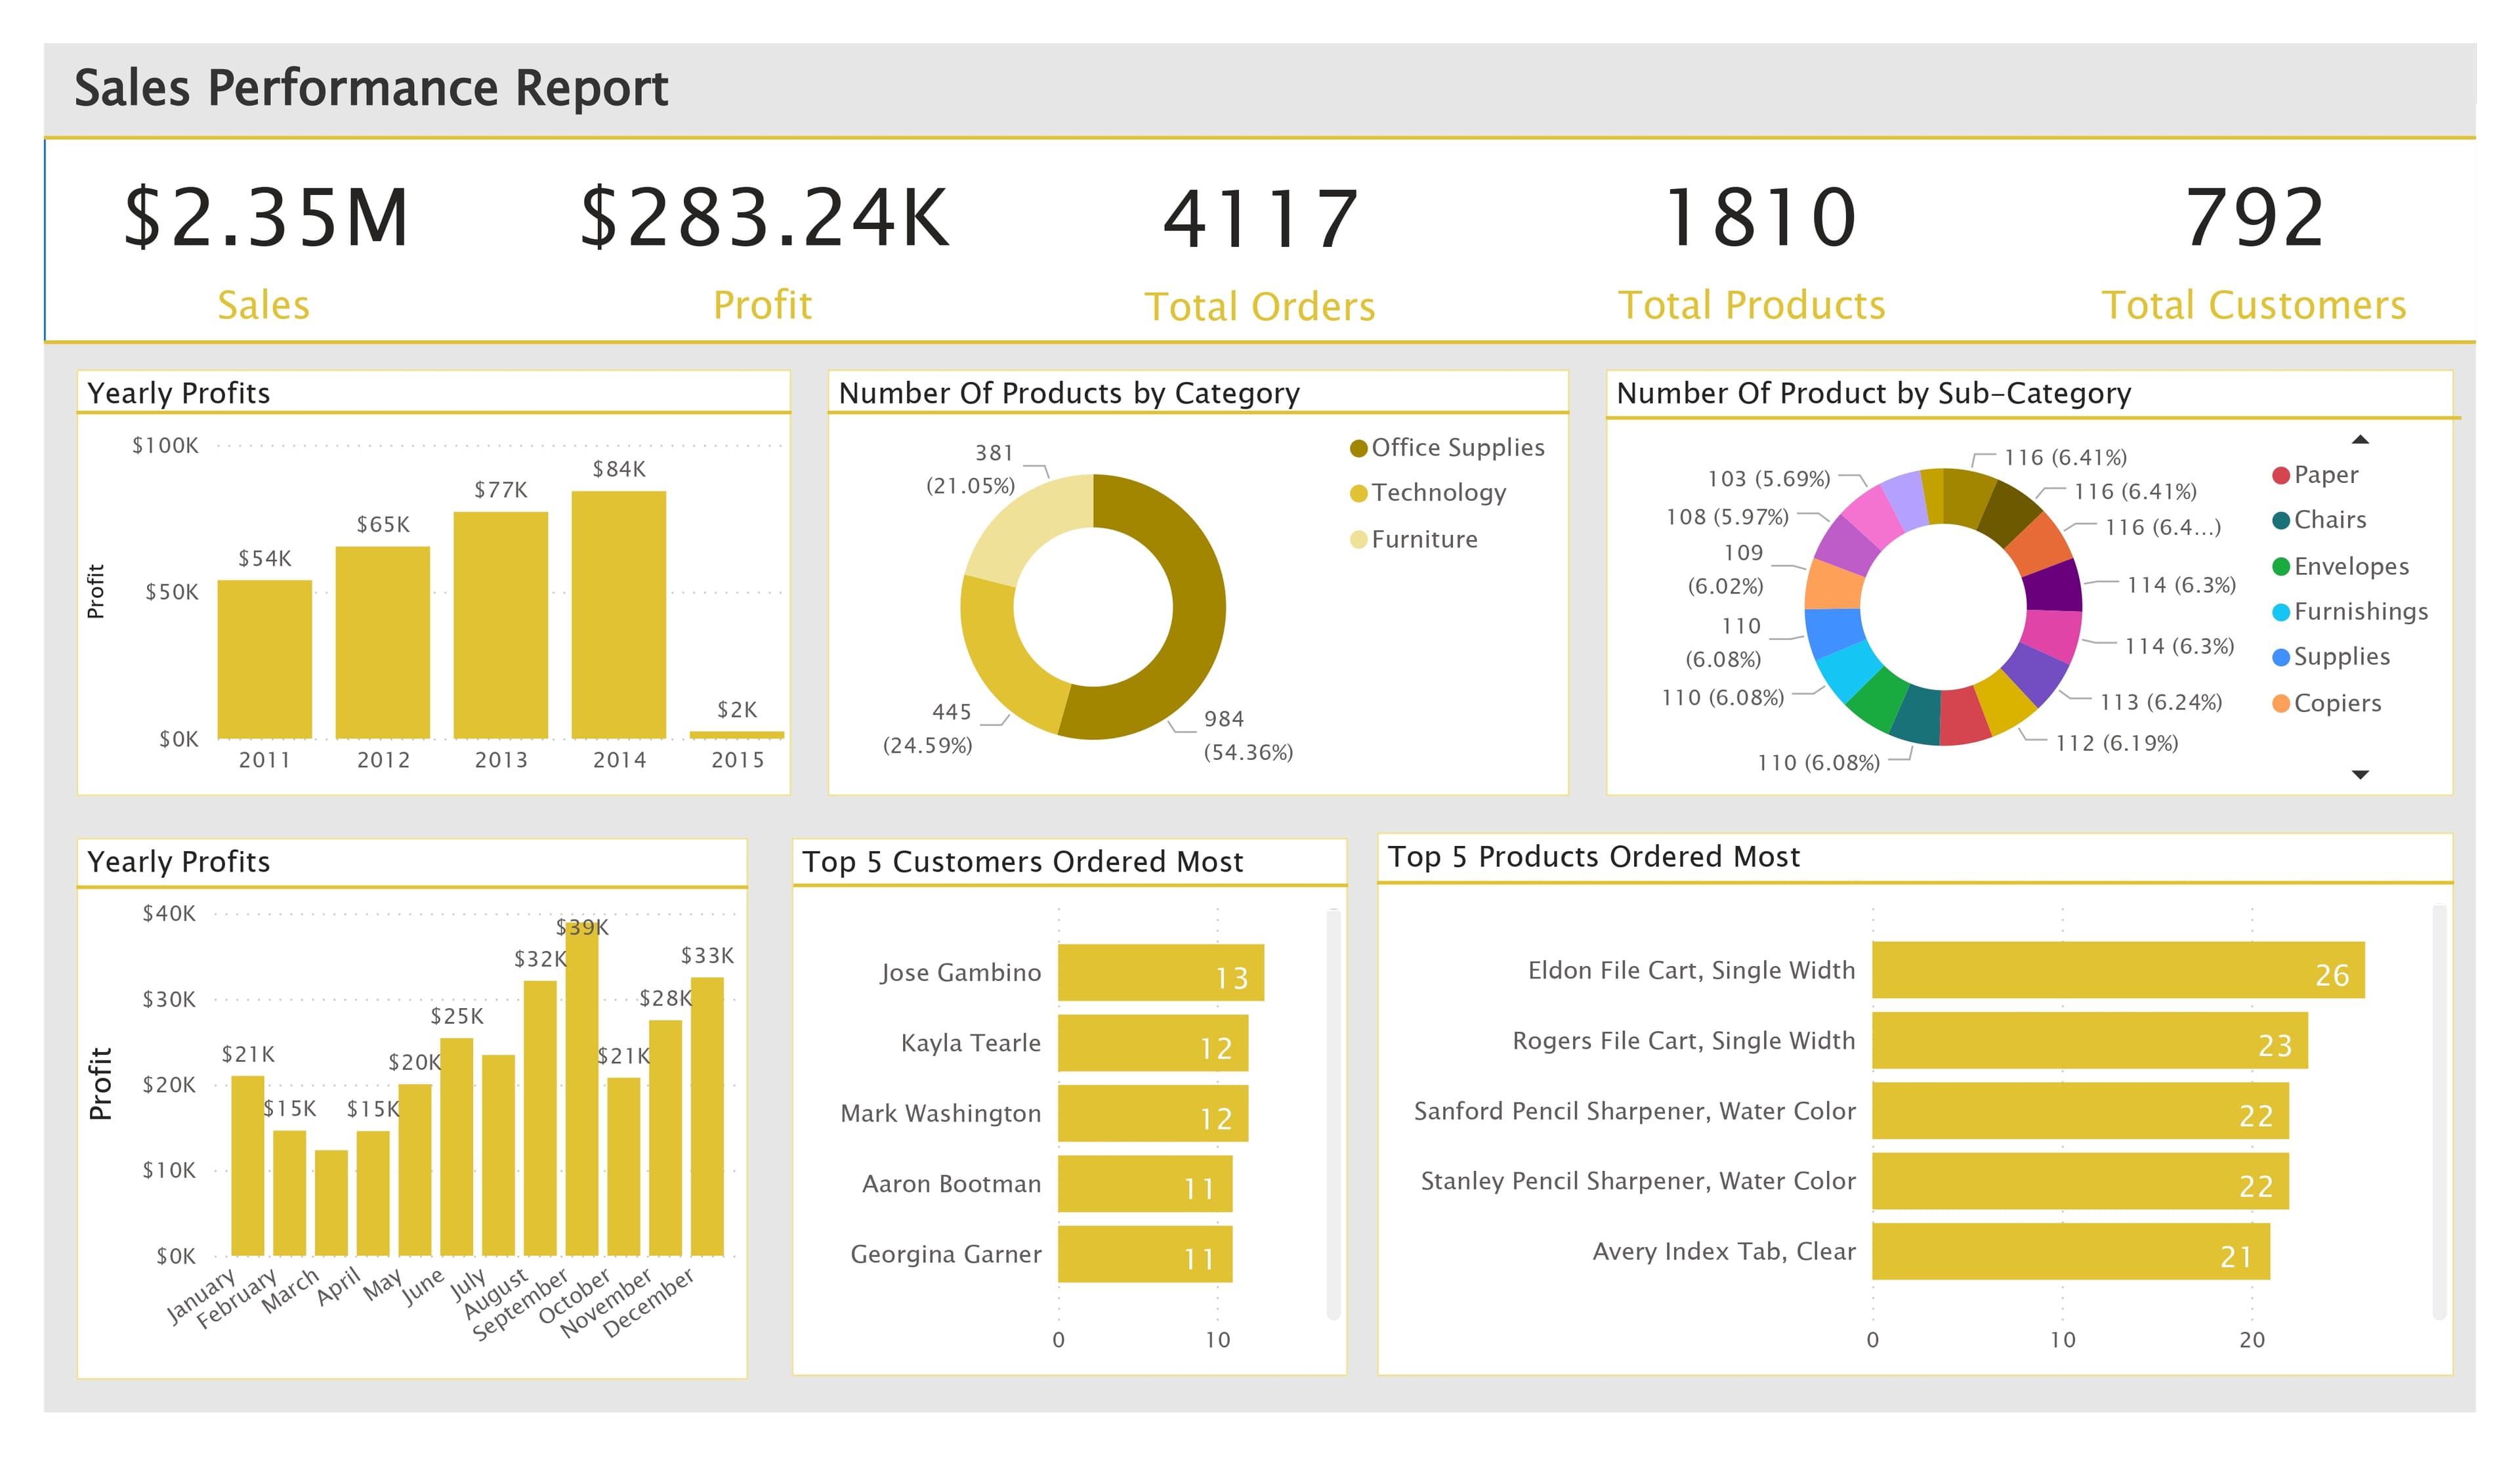
A desire for a holistic overview of sales performance, covering KPIs like sales, products, profit, orders, and total customers.
- Drill-Down Capability:
The need for drill-down functionality, starting from a yearly profit overview and seamlessly diving into monthly, weekly, and daily insights.
- Product Insights:
A craving for insights into product distribution through pie charts, breaking down products by category.
- Top Performers:
The need for horizontal bar charts showcasing the top 5 products ordered by customers, the top 5 customers ordering the most, and an overview of all customers.
Tailored Solution for Your Power BI Ecommerce Summary Report
Revolutionize your sales strategy with our Power BI-driven Sales Performance Report, offering a comprehensive snapshot of key performance indicators and insights. From sales to products, profit, orders, and total customers, our report provides a detailed view of your sales landscape.
Dive into the dynamics with drill-down functionality, starting from a bird's-eye view of yearly profit and seamlessly navigating through monthly, weekly, and daily insights. Explore product distribution with pie charts breaking down products by category.
Get a closer look at your top performers with horizontal bar charts highlighting the top 5 products ordered by customers and the top 5 customers ordering the most. Gain a broader perspective with an overview of all customers.
Our report transforms raw sales data into a visual narrative, making complex information accessible for strategic decision-making.,
